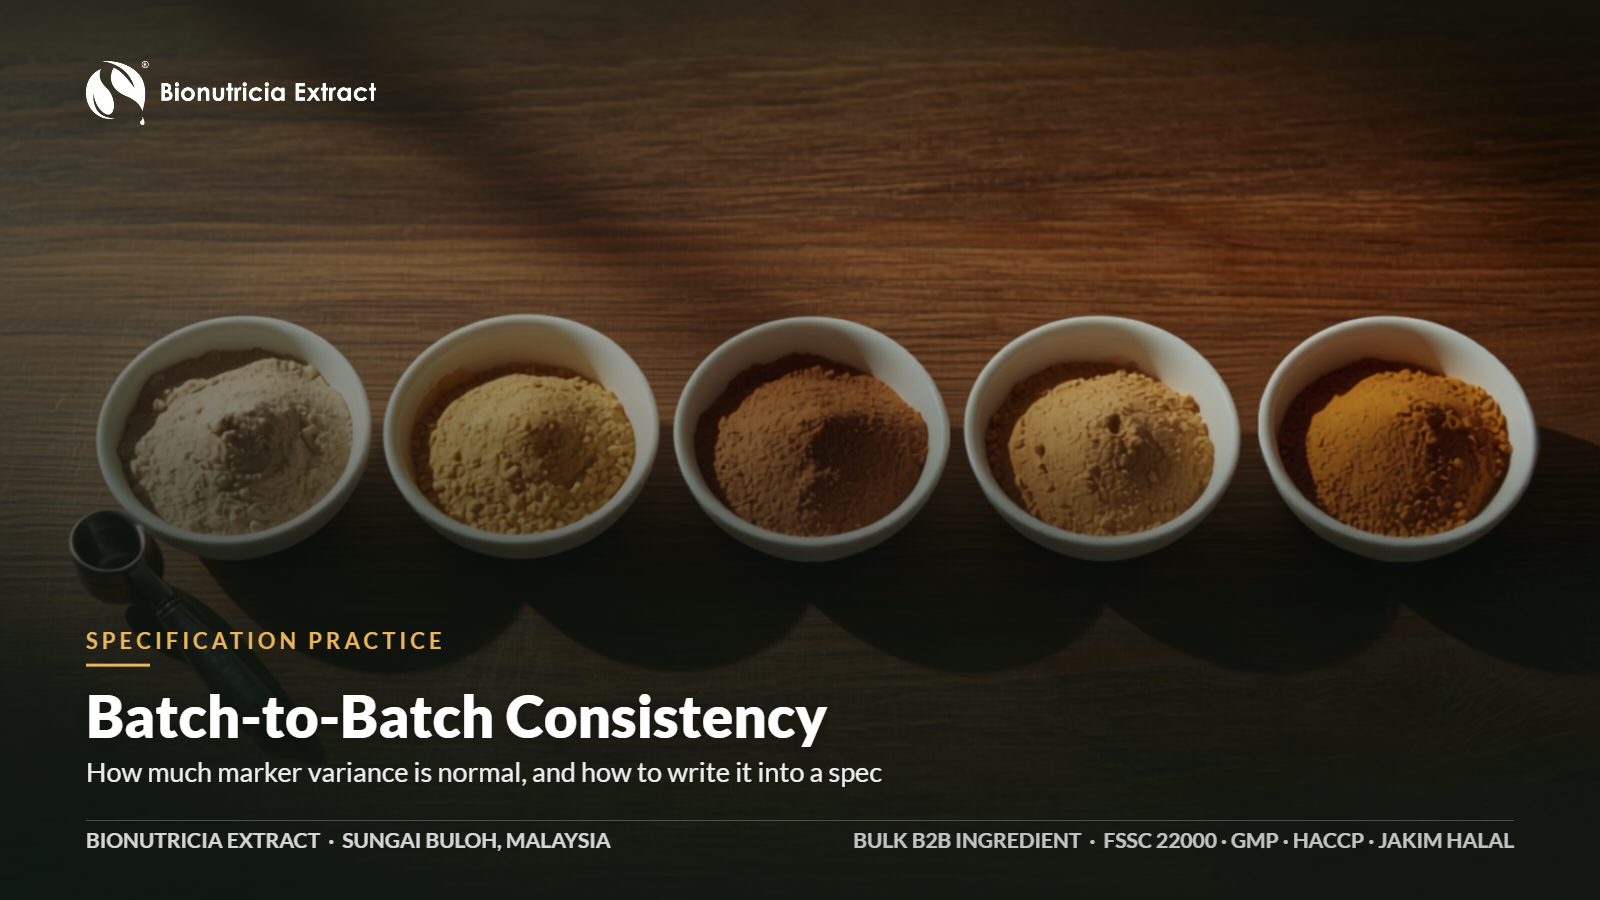
No botanical extract is identical from lot to lot, and a supplier who claims otherwise is either standardising heavily or not measuring carefully. The useful question is not whether marker content varies but whether the variance is bounded, understood and declared. For a standardised extract, a well-controlled process typically holds the marker within roughly ±10 to ±20 per cent relative around the declared value. Full-spectrum extracts vary more, because nothing is being adjusted to hit a number.
Where the variation actually comes from
Three sources stack, and they are not equal in size. Buyers usually blame the third when the first is doing most of the work.
1. The raw material — the largest contributor
A plant is an agricultural product. Marker content in incoming botanical material can vary by a factor of two or more across:
- Cultivar and chemotype — genetically different populations of the same species can produce quite different secondary metabolite profiles.
- Growing region, soil and altitude — the same cultivar grown in two locations will not assay the same.
- Season and harvest year — rainfall and temperature during the growing period move secondary metabolite production directly.
- Maturity at harvest — often the single largest controllable factor, and frequently the least controlled.
- Plant part and post-harvest handling — leaf versus stem ratio, time between harvest and drying, drying temperature.
2. The process
Extraction efficiency, solvent-to-material ratio, temperature and time, filtration, concentration and drying all shift final marker content. A well-controlled process contributes far less variance than the raw material does, but it compounds with it. Drying is worth particular attention where the marker is thermolabile.
3. The analytical method
This one is routinely mistaken for real product variation. A validated HPLC assay run in one laboratory typically shows repeatability around 1 to 3 per cent relative standard deviation, and intermediate precision — different day, different analyst, different column — of perhaps 2 to 5 per cent. Between two different laboratories using different methods, sample preparation and reference standards, a 10 to 15 per cent difference on the same homogeneous sample is unremarkable.
The practical consequence: if your incoming laboratory reports 4.2 per cent and the supplier’s Certificate of Analysis says 4.8 per cent, you may be looking at method difference, not a bad lot. Before raising a deviation, confirm both laboratories used the same method, the same marker definition and comparable reference standards.
How much variance is normal?
| Extract type | Typical lot-to-lot marker spread | Why |
|---|---|---|
| Standardised to a single marker | Narrow — the declared value is actively targeted | Blending and carrier adjustment are used to land on the number |
| Ratio extract (for example 10:1) | Wider — no marker is being targeted at all | The ratio describes process input, not composition |
| Full-spectrum extract | Widest, and the profile shifts as well as the level | The whole native profile is carried through deliberately |
This is the central trade-off, and it is worth being honest about it with your own technical team: a tightly standardised extract buys you consistency and costs you some of the native profile; a full-spectrum extract keeps the profile and hands you the variability. Neither is better in the abstract. See standardised versus full-spectrum extracts for the fuller comparison.
The approved-sample trap
The most common consistency dispute in the ingredient trade does not start with a bad lot. It starts with an approved sample.
A buyer receives a pre-production sample, tests it, likes it, and approves the supplier on that basis. The sample becomes the mental benchmark. But a single sample is one point from a distribution — quite possibly a favourable one, since suppliers naturally send good material. Nothing was agreed about how far future lots may sit from it, because no range was ever written down.
Six months later a routine lot assays lower than the sample. It is fully within what the process normally produces, and it may well be within the written specification. The buyer nonetheless experiences it as a decline in quality, because they are comparing against a point, not a range.
The fix is procedural, not technical: ask for assay results from three to five recent production lots before approval, not one sample. That shows you the distribution. Then agree limits against the distribution, and keep the retained sample for identity and sensory reference only — never as the numerical benchmark.
Writing consistency into the specification
Six things belong in the clause, and most specifications carry only the first.
| Element | What good practice looks like |
|---|---|
| The marker, defined precisely | Name the exact compound or compound group, not a loose category. Total phenolics and a named single flavonoid are different specifications. |
| The analytical method | Name it. HPLC and a colorimetric assay will not agree, and neither is wrong. |
| A single-lot range, not just a minimum | A bare “not less than” invites over-delivery, which shifts your finished-product dose upward and can be as unwelcome as a shortfall. |
| A running-mean expectation | Individual lots may sit anywhere in the range; the mean across a rolling set of lots should sit near the declared value. This is what stops a supplier living permanently at the bottom of the range. |
| The reference standard | Pharmacopoeial or a defined source. Different reference standards shift results by more than most buyers expect. |
| A change-notification clause | Written notice before any change to raw material origin, cultivar or process step that could move the profile. |
One additional habit that costs nothing: plot the assay result of every lot you receive on a simple run chart. Specification limits tell you whether a lot passes. A run chart tells you whether the process is drifting — and drift is visible long before the first failure.
Related guides
Frequently asked questions
How much marker variation between lots is acceptable?
For a standardised extract, a well-controlled process commonly holds the marker within roughly ten to twenty per cent relative of the declared value. What matters more than the exact figure is that a range is agreed in writing before supply begins, and that the running mean across lots sits near the declared value rather than at the bottom of the range.
Why does my incoming test disagree with the supplier’s COA?
Most often because the two laboratories used different methods, different sample preparation or different reference standards. Ten to fifteen per cent difference between laboratories on the same homogeneous sample is common. Confirm method alignment before treating the difference as a product deviation.
Is a retained approved sample a valid quality benchmark?
Not numerically. A single sample is one point from a distribution and is often favourable. Use it for identity and sensory reference, and set numerical limits from the assay results of three to five recent production lots instead.
Does a ratio like 10:1 guarantee consistency?
No. An extraction ratio describes how much raw material went in relative to extract out. It says nothing about the concentration of any active compound, and it does not control for variation in the incoming botanical. Only a marker assay with a declared range does that.
Should a specification set a maximum as well as a minimum?
Generally yes. A minimum-only specification allows over-delivery, which raises the actual dose in the finished product and can create both a formulation and a labelling problem. A defined range protects both sides.
Want to see the spread before you commit?
Bionutricia Extract can provide marker assay results across recent production lots alongside the specification, so you set limits against the distribution rather than a single sample.
Reviewed by Dr Yong Yi Yi, Operation Manager, PhD Food Science & Technology. General technical information for B2B ingredient buyers and formulators. Ranges cited are indicative of typical industry practice and are not a specification for any particular product. Not regulatory advice.